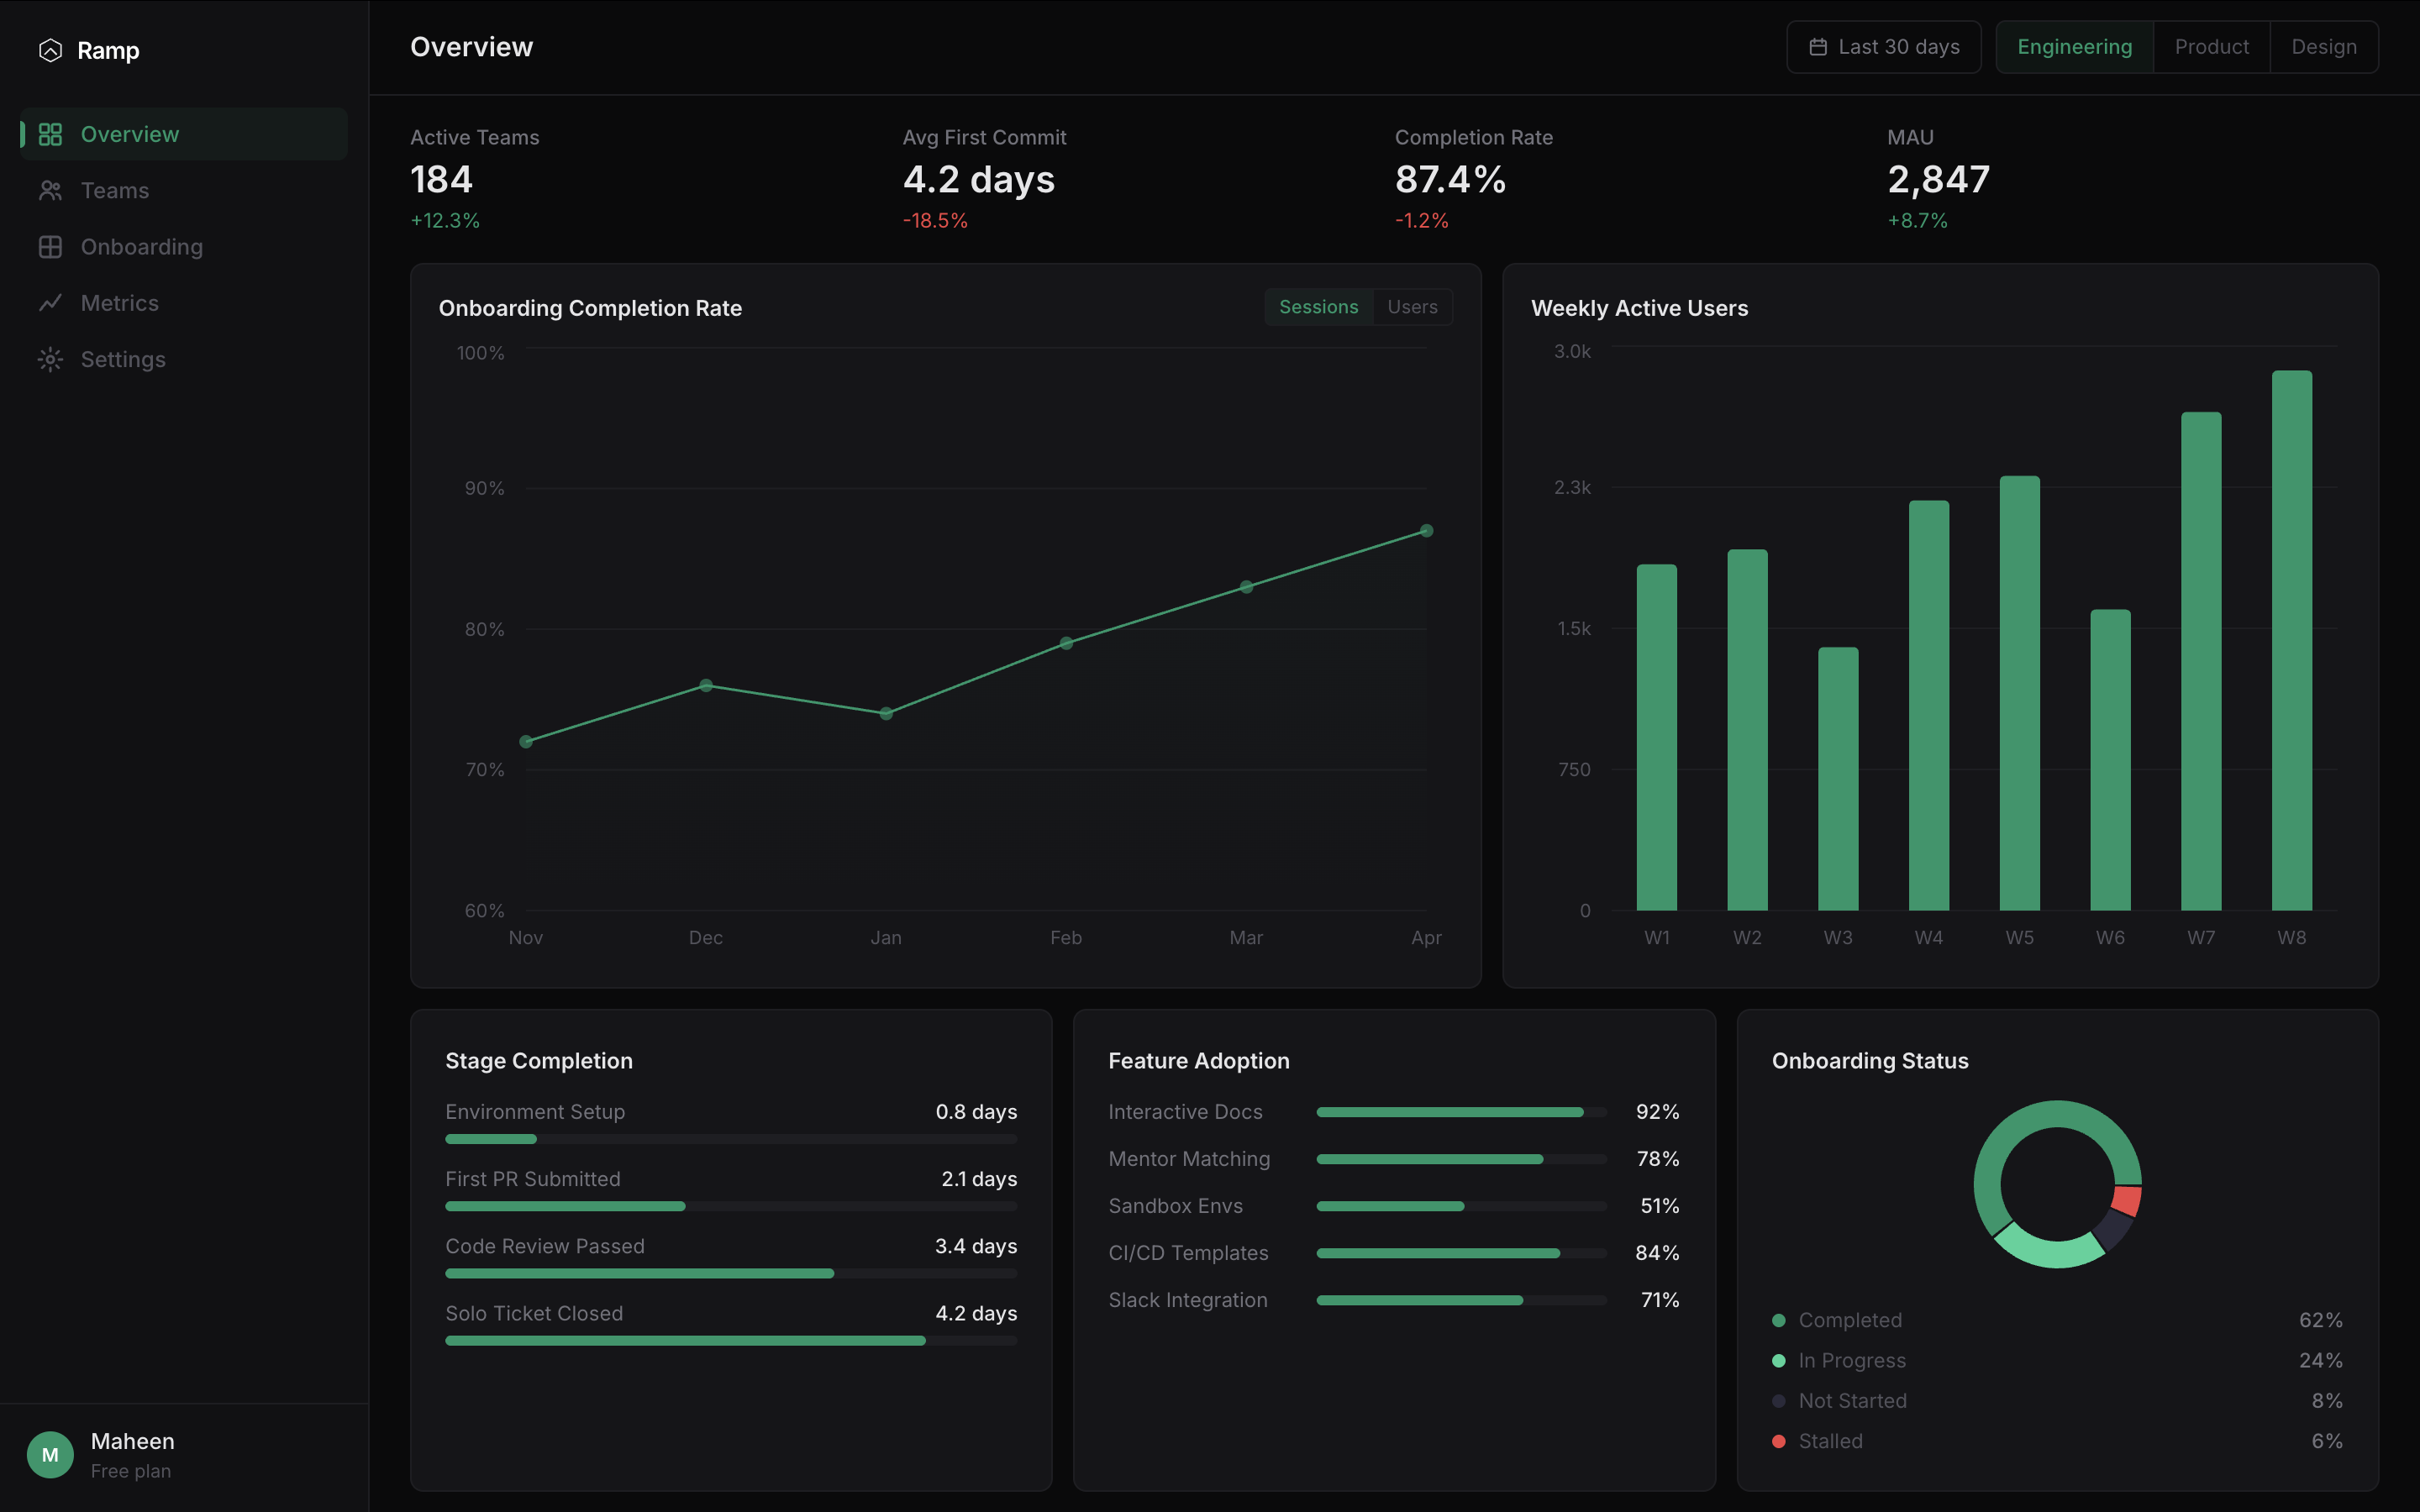
making onboarding visible
engineering teams scaling past 20 people consistently struggle with onboarding. new hires take weeks to submit their first meaningful pull request, but engineering managers have no centralized way to see where bottlenecks happen. ramp is a fictional b2b saas dashboard that gives engineering managers visibility into onboarding health: how fast new devs ramp up, which resources they actually use, and where the process breaks down. i defined the metrics, structured the information hierarchy, and built the working dashboard.
designed like a real product
the dashboard uses a sidebar navigation layout inspired by linear, with a dark theme and muted emerald accents. the information flows top to bottom by urgency: kpi summary for a quick health check, trend charts for context, and detailed breakdowns for investigation. i included department-level filtering (engineering, product, design) because onboarding differs across teams. the data is synthetic but intentionally realistic -- not everything trends upward, the completion rate shows a slight recent dip, and sandbox environment adoption is lagging. the charts use recharts with real data point markers and straight-line segments instead of smooth curves, because real data doesn't look like illustrations. built with next.js, typescript, and tailwind.